Skip to content
GrowX
Insights

Twitter analytics that show what grows your X account

GrowX Insights reads your recent posts and followers through the x.com tab you already have open and turns them into clear numbers: engagement per post, the hours that work, the topics and formats that land, and how your audience is changing.

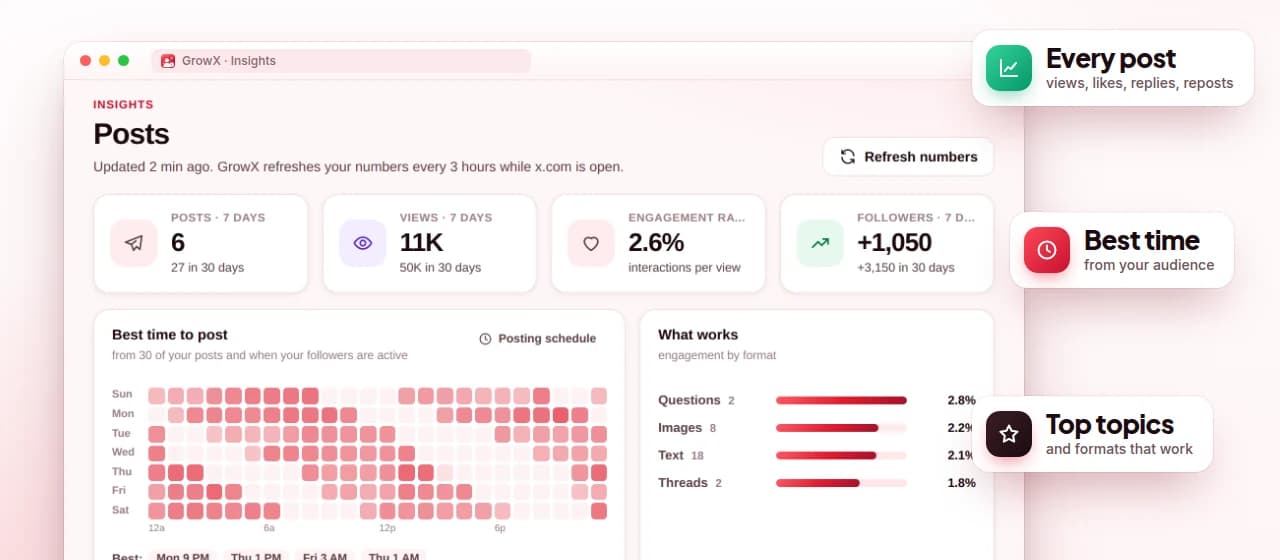
GrowX Insights page with post stats, a best time to post heat map and engagement by format (demo data)

Screenshot shows demo data.

What you get

Analytics, done right.

  • Post analytics

    Views, likes, reposts, replies, bookmarks and engagement rate for your recent posts, refreshed every 3 hours while x.com is open.

  • Best time heat map

    A week by 24-hour grid built from your own posts' engagement and when your followers are active.

  • Topics and formats

    See how questions, images, plain text, threads and links compare on engagement for your account.

  • Goals and streaks

    Daily goals for posts, replies and new followers, plus streaks, milestones, a growth chart and a monthly goal planner.

  • Premium

    Posts that brought followers

    Spot the posts followed by more new followers than your usual pace in the next 24 hours.

  • Premium

    Weekly report

    This week vs last week: new followers, unfollowers and best posts, with a notification on Monday.

How it works

Three steps.

  1. 1

    Install and open x.com

    Add GrowX to Chrome and keep an x.com tab open. GrowX reads your data from that tab, one small step per minute at most.

  2. 2

    Let it collect

    Post analytics refresh every 3 hours while x.com is open, and the follower tracker checks once a day. The views fill in as data arrives.

  3. 3

    Act on it

    Move queue slots toward your best hours, do more of the formats that work and check the weekly view to see what changed.

What GrowX Twitter analytics measures

Insights starts with post analytics: views, likes, reposts, replies, bookmarks and engagement rate for each of your recent posts. The numbers refresh every 3 hours while an x.com tab is open, so you can watch how a post develops over its first day instead of checking it by hand. The free plan covers your latest 30 posts.

What works groups your posts by topic and format (questions, images, plain text, threads and links) and compares their engagement. Over a few weeks this answers practical questions: do your threads do better than single posts, do images help, do links hurt? Answers based on your own account beat general rules, because every niche and audience behaves differently.

The growth chart and history show your follower count over time. Daily goals for posts, replies and new followers, streaks, milestones and a monthly goal planner turn the numbers into a routine you can actually keep, which matters more for growth on X than any single post that happens to go viral.

Best time to post on Twitter, for your account

Generic charts of the best time to post on Twitter mix many accounts, time zones and niches. GrowX builds a week by 24-hour heat map from two signals that belong to you: the engagement your own posts got at each hour, and when your followers are active. Warm cells are hours worth testing; cold cells are hours to avoid for important posts.

The heat map is most useful together with the post scheduler. Move your queue slots toward the warm hours, post there for a couple of weeks and look again. If the pattern holds, keep it; if not, try the next warm block. The best time to post guide walks through a simple testing routine.

Which posts brought followers (Premium)

Engagement and follower growth are not the same thing. A post can collect plenty of likes from people who already follow you and bring nobody new. Which posts brought followers, part of Full analytics in Premium, looks at the 24 hours after each post and highlights the posts followed by more new followers than your usual pace.

The weekly report (Premium) compares this week with last week: new followers, unfollowers and best posts, with a notification on Monday. Together with the unfollower tracker, it shows both sides of growth, who arrived and who left, so you can tell whether a change in your content helped or hurt.

Privacy and how the data is collected

GrowX reads everything through an x.com tab that is already open, one small step per minute at most, so there is no separate login and no X password. Your settings, history, posts and analytics stay in Chrome's storage on your computer rather than on a GrowX server. Optional anonymous usage counts, which contain no X data, can be switched off.

The trade-off is coverage. GrowX only knows what it has seen while Chrome was running with x.com open, so a fresh install starts with your recent posts and builds history from there. X's own analytics remain the official record for your account; GrowX adds the comparisons, timing and follower links in one place next to your scheduler and goals.

Plans

What's free, what's Premium

Every Premium feature is included in the free 30-day trial. No credit card.

Free $0 forever

  • Post analytics for your latest 30 posts
  • Best time to post heat map
  • Topics and formats by engagement
  • Growth chart, history, daily goals, streaks and milestones
  • Follower tracker with 7 days of history and top fans

Premium from $1.99

  • Full analytics, including which posts brought followers
  • Weekly report with a Monday notification
  • Full follower history and follower quality
  • Weekly summary from GrowX AI
  • All included in the free 30-day Premium trial, no credit card
FAQ

Analytics: your questions

Is there a free Twitter analytics tool?

Yes. GrowX's free plan includes post analytics for your latest 30 posts, the best time to post heat map, topics and formats, a growth chart and daily goals.

How does GrowX get my X analytics?

It reads your posts and followers through an x.com tab you already have open in Chrome, one small step per minute at most. It never asks for your X password.

How often are my X post stats updated?

Post analytics refresh every 3 hours while x.com is open, and the follower tracker checks once a day.

Can I see which tweets gained me followers?

Yes, with Premium. Which posts brought followers highlights the posts followed by more new followers than your usual pace in the next 24 hours.

Where is my Twitter analytics data stored?

In Chrome's extension storage on your computer. Settings, history, posts and analytics stay there, and you can export a backup file at any time.

More from GrowX

Related guides

Start growing on X today.

Install GrowX for free and create your account in under a minute. Try every Premium feature for 30 days: no credit card, no commitment.